Blog by Alysha Meno, 2018 FOR Guam summer intern
Hey guys, hope you all stayed safe during the tropical storm! Before it arrived we were able to meet up twice this week at the Merizo site and a meeting to discuss our data.
Day 1 of this week we continued algal removal on/around coral colonies in Merizo. Here’s an update on the catch bags: We did put them in buckets with small holes in the bottom and attached a pool noodle around the top part of the bucket, so it stayed above water (Thank you for your help, Farron and Val!). This helped prevent the bags from dragging/stirring up sediment and kept afloat, making the algal removal process a lot smoother. We just had to remember to hold onto them since they can float away!


We used the GPS unit to find our sites and laid out our transect tape. From there, on both sides of the tape we used one-meter survey rods as boundaries. We removed algae on/around corals within 2x25m area at each transect. Most of what we collected was a brown algae called Padina species (sp.).
As we removed algae, we noticed more invertebrates and fish appeared around the corals. In one crevice, we discovered a snow eel that peeking out curiously after we removed a lot of Padina sp. We also noticed fish began eating the turf algae from the corals we cleared and came toward us and helped graze on the turf algae. It was a cool to see an immediate reaction from fish!
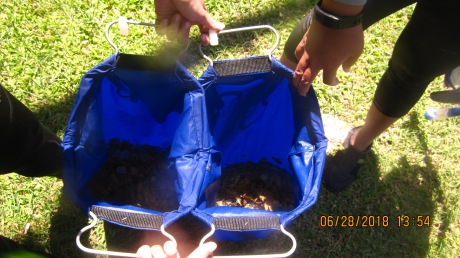
Once we completed algal removal, we returned to shore. We drained the water out of the catch bags for the same amount of time and weighed them to see how much we algae collected. The heaviest bag weighed about 6870 grams (or 15 lbs!). We repeated this method on our last transect and called it a day.
The next day was a short workshop on inputting data into Microsoft Excel. We took the information we collected out in the field and neatly inputted into a few spreadsheets. Our supervisor also taught us how to create graphs to illustrate data as visualizations that will help present our project to others. We ended with a discussion on how the field work went the previous day and to think about some hypothesis we have for our projects. Check in next time for our next update!
